A Shakeup in the Top 25 Marketing and Social Media Blogs

OH YAY!Last week, Mack Collier explained that he was switching his measurement for the Top 25 Marketing and Social Media blogs away from Technorati to Feedburner subscriber numbers. This has seen a big change in the blogs that make up the Top 25 — I am guessing this is mostly to do with the fact that many blogs don’t publish their subscriber numbers (or perhaps don’t even use Feedburner).

Now, I don’t actually publish my subscriber numbers — but it has not been a hard and fast decision. What do you think? Should I? What does it mean to you? Does a subscriber count influence your decision to read/subscribe? Does it influence the way you feel about a blog?

For the record, one of the reasons for not publishing is that I had setup three feeds very early on. I was able to consolidate down to two, and now have both running about neck and neck (about 600 each). And while I have tried to consolidate the feeds, I can’t quite get it to work. All new subscribers, please use this feed.

Mack’s list for week 120 is as follows. Congratulations to all on it!

1 – Duct Tape Marketing – 220,000 (LW – 6)
2 – Church of the Customer – 209,000 (LW – 8)
3 – CopyBlogger – 42,780 (LW – 2)
4 – Search Engine Guide – 12,173 (LW – 4)
5 – Chris Brogan – 8,319 (LW – 3)
6 – Influential Marketing – 6,985 (+12)(LW – 7)
7 – Logic + Emotion – 3,564 (LW – 5)
8 – Converstations – 3,219 (LW – 20)
9 – Drew’s Marketing Minute – 3,203 (LW – 15)
10 – The Viral Garden – 3,063 (LW – 25)
11 – Experience Curve – 2,775 (LW – UR)
12 – Conversation Agent – 2,713 (LW – 12)
13 – Techipedia – 2,300 (LW – 13)
14 – The Social Media Marketing Blog – 2,079 (LW – 19)
15 – Emergence Marketing – 1,829 (LW – UR)
16 – The Social Customer Manifesto – 1,672 (LW – UR)
17 – Techno Marketer – 1,367 (LW – 23)
18 – Social Media Explorer – 1,332 (LW – 18)
19 – Movie Marketing Madness – 1,231 (LW – UR)
20 – Daily Fix – 1,111 (LW – 10)
21 – Customers Rock! – 849 (LW – UR)
22 – Shotgun Marketing – 721 (LW – UR)
23 – Biz Solutions Plus – 541 (LW – UR)
24 – Resonance Partnership Blog – 301 (LW – UR)
25 – MediaPhyter – 116 (LW – UR)

How Sociable are You

When we think of the “top blogs” or the most effective social media / digital projects we fundamentally think of measurement. Underlying any rating system, from Mack Collier’s Top 25 Marketing and Social Media Blogs through the AdAge Power 150 to Meg Tsiamis’ local Top 100 Australian Blogs or Julian Cole’s Australian Marketing Pioneer Blogs, at play is a form of measurement. These rely on a whole range of (mostly) publicly available data.

Drew, Luc and GavinFor example, Mack’s list used to rely on Technorati rankings but is about to shift to Feedburner subscriber counts. Technorati requires the registration of your blog and Feedburner requires that your blog reader numbers be published. Meg’s ranking relies on a combination of the Technorati ranking and the Alexa traffic ranking (which in itself requires the installation of the Alexa toolbar to track and submit user data). AdAge uses a range of data as well as a personal ranking from Todd Andrlik, the index’s inventor — and Julian has employed the same approach, with a subjective “pioneer score”.

But no matter how many elements you combine to measure the impact of your blog, your branding, your product launch etc, the challenge is finding a way to simply aggregate the scores and balance them in a way that makes sense for the large brands that dominate our consciousness as well as those who happily make waves in the long tail.

Ari Herzog points out a tool that may actually give us some relief — focusing on the conversational power of your brand. How Sociable allows you to track your brand across 22 different metrics to produce a visibility score. This score draws upon quite a range of data from Technorati, Google, Facebook, Upcoming, Vimeo, Flickr, YouTube, Bebo, Twitter, Magnolia and Delicious, Photobucket, LinkedIn, Yahoo, Ning and MySpace — and no doubt this will expand as uptake continues. The thinking behind the visibility score is:

We took a set of benchmark results using one globally recognised traditional brand and gave it a score of 1000.  To ensure that even small, local brands would register we made it a sliding scale.

Unfortunately, in terms of ranking blogs, it does not include subscriber numbers which do actually provide a consistent form of readership. However, adding subscription numbers via a formula could provide a real sense of the spread of your social media footprint.

Perhaps, more importantly, for marketers, How Sociable could provide a much needed (and free, for the moment) method for measuring the success of your social media outreach program. Why don’t you give it a try? Drop your name, your blog or your company name into the box and see what comes back.

For the record, “gavin heaton” returned a score of 42, just slightly below the 44 achieved by “servantofchaos”. How sociable are you?

Measuring Community Velocity

When you are involved in a community you can really get a sense of its health. You know when it is active and you know when it is in decline. Think about the social networks that you use, think through the amount of time that you spend using the site/application. Multiply that out by the number of friends or colleagues that you engage with using it … and then think about the number of circular, “viral” type elements that feed, sustain and grow the membership. How many are you involved with, and how active?

Now, it is easy to sense a velocity of engagement, but what is the evidence for this “sense” — after all, one of the challenges of social media is measurement. Where and how do we start?

Well, it seems that Rachel Happe has given this a great deal of thought and come up with a metric that, on the surface, looks pretty good. Here is what Rachel suggests as input and outcome:

The inputs:

  • Total members for a given month
  • Total active members for a month
  • Total posts (this can be a blog post, a wiki post, a discussion item, a link) for a month
  • Total addressable market (how many members would you have if everyone was in the community – this will be a rough estimate)

The Community Velocity Metric:

  • ((% of active members * # posts/per member/period) + total members ) / TAM

Now, Rachel freely admits that the total addressable market may be very large (in the case of a brand community), but a good guess will yield a CVM of around 0.01 for new communities and 0.03-0.04 for the more mature community.

But think about this in action. What would happen if we applied this to Twitter or some of its new competitors like Plurk or even older stalwarts like Pownce. I whether the CVM can help us predict a community (or an application) with a growth trajectory — or one experiencing the first pangs of disaster. Perhaps we may know sooner rather than later!

What’s In Your Social Media Pipe?


  pipe dreams 
  Originally uploaded by ChrisJackson

Ever wondered who is creating digital media about you — or your product? Ever wanted a different way to report to your client on digital touch points? I just found this rather neat Yahoo Pipe that scours the web for all different types of media. It is called the Social Media Firehose. Originally created by Kingsley Joseph to monitor references to salesforce.com, the pipe can also be modified to search any term you desire.

So when I did a vanity search on "Gavin Heaton" it actually turned up a range of unexpected content. There were photos from my Flickr account, images where I was tagged at Blogger Social, Technorati feeds, comments, discussions and posts. All of these were aggregated in a neat way, showing the location or origin on a Google Map or in a simple list.

So, do you know what is in your social media pipe? And is it a dribble or is it really a fire hose?

Measuring Audience 2.0


  Eyeballing 
  Originally uploaded by fotologic

So I am sitting there in a meeting in a far-off Asian country. Seated all around me are marketing managers and directors from my client’s company. My colleagues and I are slightly jet lagged but hyped — the countdown to our presentation is only minutes away. We just have to wait through one more presentation on "digital strategy" from another agency. The irony is not lost on us … we are, after all, about to present a solution to the challenge of digital strategy — and we feel like we have nailed it.

Then it starts. Well, I thought — "I don’t know a lot about digitial". Hmmm. "But what I do know, is you can’t measure it". What? I stifle the intake of my breath. This is not the time. This is not the place.

To my surprise I look around the room and observe a sea of nodding heads. Not a dissenting voice. Not one.

As I mentioned in this post on measurement some time ago, the idea of tracking hits and even page views seemed quaint and outdated. But what if there really was an AUTOMATED way of measuring what your audience … or what your PARTICIPANTS were interested in? What if you could use this to refine your site/project/marketing efforts — on the fly?

Josh Catone has an interesting article on the new Alenty  site engagement measurement tool. Sure it seems to be focused on banners, but I have a feeling that it would be much more beneficially deployed under the hood of your community system. Imagine if Microsoft turned this on for Facebook? How about a widget for Typepad that allows bloggers to tap into the data about their blogs? Or imagine what this would mean for game developers?

In the future, this sort of technology will be mandatory for all branded content. Not only that, when combined with upstream and downstream analytics, the potential for us all to understand what works, what doesn’t and the IMPACTS of our cohesive branding, design and experience efforts will transform the business of branding. And yes, it really is all about the audience. Don’t let anyone tell you otherwise.

HumanSigma – Valuing Brands Gets Serious


book-of-lies_subway
Originally uploaded by wvs

Whenever an investment is proposed, the first question that is asked is, "what is the return?". In some instances the return on investment is easy to calculate — for example, automating repetitive tasks dramatically reduces transactional costs. But for intangibles such as "innovation" or "brand", metrics are a challenge. It’s not that we don’t WANT to measure the return on investment, it is just more difficult to measure and weigh the impacts of many inputs.

In a tweet yesterday, David Armano pointed me towards Mitch Owen’s interesting post at Lead2020 blog where he talks about Human Sigma — a new book by Gallup Consulting’s John Fleming. This is an approach that measures the emotional attachment of employees and customers and attempts to systematize it in an effort to improve performance across your organisation (or brand). Where this actually has some traction is the impact that employee and customer engagement has on the bottom line — that’s right — the intangibles provide a STRATEGIC contribution. Gallup’s research validates our suspicions that a happy workforce is a productive (and profitable) workforce — those companies with a highly engaged workforce grew earnings per share at over 2.6 times the rate of companies with low engagement ratings.

So how do you measure "engagement"?

The Gallup methodology is built around twelve questions that measure dimensions that leaders, managers and employees can influence. That is, the questions when answered, provide you with points that can be acted upon immediately. I have captured the twelve questions in the above graphic.
According to Mitch, the model for customer satisfaction revolves around for levels of emotional engagement:

Confidence: What are you doing to create customer trust in your services? Would your customers say you always deliver on your spoken and unspoken promises?
Integrity: Do you treat your customers fairly? When something goes wrong, do you apologize for the problem? How fair are you in resolving the problem?
Pride: Do your customers have a positive sense of association and identification with you? Are they proud to be your customer? Does their association with you mean something to them personally? Does it define their own self-concept of who they are?
Passion: Would your customers consider life not worth living without you? Ok.. that is a bit much, but the concept is the same… Are you indispensable? Would they drive across town for you? How much passion do they have for you?

Of course, the challenge is measuring these and combining them into a HumanSigma metric … which is where, I am sure, Gallup Consulting come into play. Nevertheless, this is EXACTLY the thing that agencies should be investigating … and one of the reasons that I continue to think that the greatest threat to the Agencies will come not from "digital" but from "consulting".

But here is a challenge for you … if you were to apply these twelve questions to a brand … what would they be? I am going to have a go at this too … but I would love to know your thoughts!

Finding the Gold in Digital Measurement


Daily Microcosms 1
Originally uploaded by David Bez

Remember when the daily digital microcosm revolved around "hits". There was much talk and bravado about the hits, the "eyeballs" and (in those advanced shops) the "visitors". We puffed out our chests, talked up the "power" of the Internet, and tried to convince businesses to trust our expertise as we surreptitiously added their domain names to our vault of registrations.

Then, as the conversation dulled and we all got used to the basic metrics, we reached for some other measurement. We shifted to "up time", "click throughs", and when pushed "unique visitors". But again, all these measures seemed loose, too interpretive and indistinguishable. They didn’t apply to "brands", just websites … they didn’t work for the business consultants, the CFO or the board … and our own reluctance to commit to concrete measurables saw "digital" initiatives pushed to the side as "non-core" capabilities.

But then a strange thing happened. The web became "accepted". Business models emerged. Amazon blew the covers off the technology and showed that there was money to be made … and Google … well, Google just is.

Yet despite these well-known successes, for the vast majority of digital agencies (and marketing departments) out there, the web is still green fields. Businesses continue to think that they can contract an agency to build a site for $30-$50k while spending multiples of this amount on non-descript, untargeted TV advertising. The old ways die hard.

Some time ago, Katie and I were working on a web project and we needed to find a new way of measuring activity. Not for our clients, mind … but to help us understand what was working and what needed to be improved. We were thinking engagement, brand and conversation. We were thinking aggregation as well as targeting, we were aiming for word of mouth, conversion and funnelling.

When we started doing this about three years ago, it was speculative, but over time it allowed us to map and understand online consumer behaviour. It demonstrated to us that page views were as important as click throughs and that content strategies, multi-format integration and "directed play" all helped to build your brand, excite your audience and encourage loyalty. We called it, loosely, "time with brand".

Herb points to a study that confirms this approach. The report explains that both implicit and explicit memory are important in building brand recognition — and this, in turn, means that it is important to measure impressions as well as the more performative metrics. Sounds obvious now … but it makes you think — what is next for metrics and measurement. And who will seize that ground. There is a goldmine waiting.

Is This My Sphere of Influence?


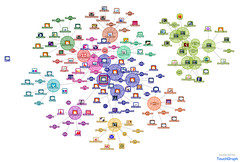
TouchGraph
Originally uploaded by servantofchaos

I found this neat tool on Darren Rowse’s Problogger site.

You can map keywords or you can simply enter a URL. To get this map (and to watch it grow in front of my eyes), I entered servantofchaos.typepad.com.

Not only do you get a funky looking map that shows the sites linking to you (and the sites that link to them), you get a great long list with short descriptions. To do this, TouchGraph calls on the Google search database. BUT … this is not all TouchGraph does. It also works for Facebook — and links to your friends, shows their networks and their photos.

Neat.