Visual content attracts people to your site and services. But visual content – and in particular – infographics -have a very specific job to do. They have to help progress your customer’s journey.
Around 60% of customers have already done research and are thinking about buying by the time they find your website. This means:
- 60% of your visitors need more information from you to help convince them to proceed
- 40% aren’t even at the “awareness” stage.
This makes for challenging messaging.
How then is it possible to:
- Make a lasting and memorable first impression?
- Keep your visitor’s attention long enough to begin a deeper engagement
- Convince your visitor to provide some kind of contact information (eg email or phone).
The SEMrush folks have some great statistics on capturing attention:
- 90% of information transmitted to the brain is visual
- Captioned text is read 4x more than body copy
- 50% of your brain is active in visual processing
- 70% of your sensory receptors are in your eyes
- We process images 60,000x faster than text
- 40% of people respond better to visuals.
But visuals are not a silver bullet. They are part of your engagement and lead generation toolkit.
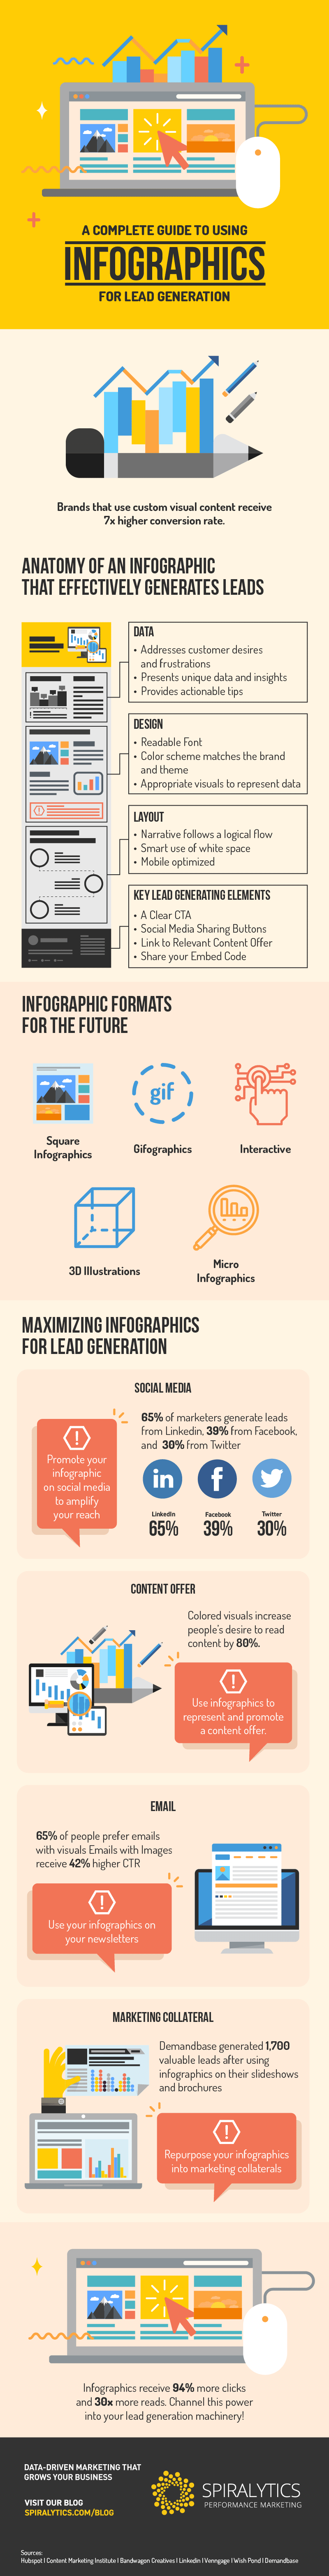
Spiralytics have put together this handy infographic on creating infographics. It shows how you can use data, design, layout and messaging to create a relevant, shareable, lead generating infographic.
The next thing, of course, is to get your infographic in front of your audience. And that’s where your strategy will need to kick in.